
 by
by How visual management can enhance every aspect of a practice
By Dr. Sami Bahri
 Visual management is powerful because it is simple. It has only one function: to report occurrences of abnormalities in a speedy manner, (Shingo, 1989) allowing us to take swift measures that prevent their recurrence (Ohno, 1988). For example, if an assistant has to stop the flow of treatment and go bring a product from the supply room, her walking out of the operatory should be a visual indicator that we need to store the product closer to her; ideally, this change should happen, before she needs to use the product again.
For more clarity, let’s define normal and abnormal. Normal conditions are those where work progresses as planned. However, work, patient, and provider conditions vary all the time, making conformity to standards difficult or sometimes even impossible. We call abnormal those conditions that push results away from the standards established by our systems. Abnormal conditions tend to generate problems that lead to poor results. To prevent problems, we can use visual management methods at two different levels: first, to prevent abnormalities from occurring, we make work standards easily accessible to workers. Second, to catch abnormalities when they occur despite our careful planning, we create rapid detection measures that expose them as soon as they deviate from standards. (See Figure 1)
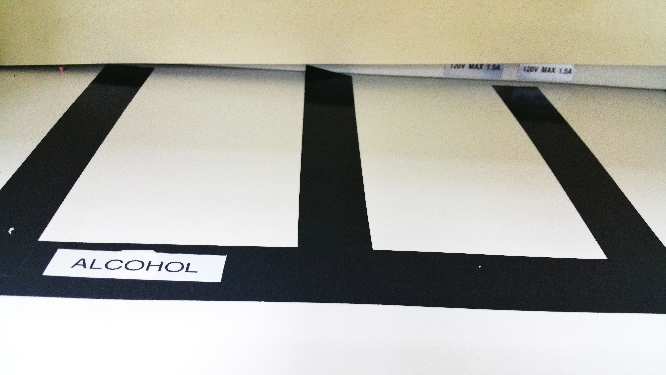 Figure 1: The location on the left is a useful visual tool because it exposes an abnormality: the alcohol bottle is missing.
Focus on the work structure for better improvements
Visual management can enhance every aspect of a practice, front desk, scheduling, maintenance, hygiene, treatment rooms, recall systems, treatment progress, materials ordering, equipment placement – the list is endless. But in the first place, we are interested in visualizing the very fundamental aspect of production, the structure of work. In fact, improvements at that deep level multiply as they trickle to the more superficial aspects of production; just as placing nutrients at the roots of a tree has a better effect than placing them on the branches.
Understanding the structure to illustrate, let’s consider the sequence of steps in Figure 2 that could take place when examining a mouth and performing a filling:
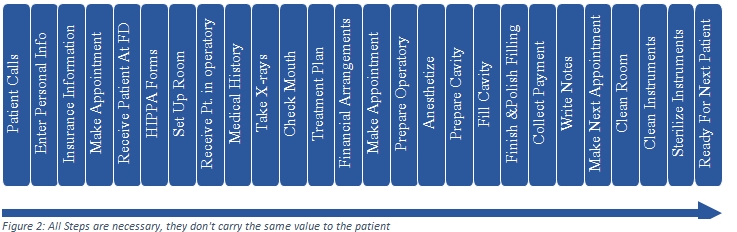
All the steps in Figure 2 are necessary, but patients are interested in only a few of them as we can see in Figure 3 below.
It has been believed in the past that improving every step of such a sequence will improve the whole. In fact, improving the steps independently from the whole process could lead to detrimental effects.
Others think that taking part of the sequence and improving it, then improving a second and a third part will improve the whole. Although that could be partially true, the reasoning that will follow has proven more effective in many lean companies like Toyota, in healthcare organizations like Thedacare and Virginia Mason, and, more relevant to this article, in our dental practice.
What patients perceive determines our degree of success
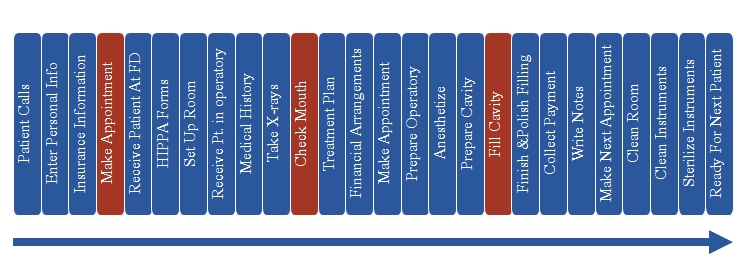 Figure 3: Patients perceive value in the steps in red. They are willing to pay only for those.
If we asked patients about their dental visit, they would probably say that they made an appointment, had their mouth checked and their tooth filled. Those three steps are part of what is called the patient experience depicted in Figure 3.
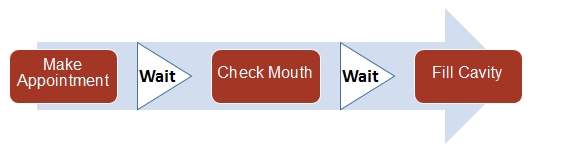 Figure 4: Patients perceives only the onstage steps. Even at a higher cost, those steps have to happen efficiently to guarantee a good patient experience.
The steps in Figure 4 are called the value stream by some authors, process by others. The better they are delivered the more positive the patient experience. They will determine patient satisfaction levels, and whether they will return and refer friends to the practice.
For visual management to be effective, it needs to help in making the value stream more productive. The single most important factor in increasing productivity is the elimination of wait between steps. The main form of waiting to eliminate is making a new appointment when we can perform the next step in the same appointment. Another form of waiting to eliminate is when the patient is in the dental chair for treatment.
In Figure 3 waiting is represented by the triangles. In order to eliminate waiting, as soon as a provider (hygienist for example) finishes her part of the treatment, the next provider needs to start her part. To that end, we have created a position called flow manager. A flow manager orchestrates the sequence of work, armed with a paper we call Kanban – Japanese for signal.
We know of no electronic device that can be as effective as a colored piece of paper to visualize and synchronize providers’ time with treatment flow .As described in a previous article, a Kanban holds all the information needed to ensure the movement of providers between patients.
The team members’ view
While the patient is interested in only three steps of the process, we see that staff members perform many more operations. The remaining necessary steps, although representing the majority of the actual work, serve to make the value stream flow smoothly.
This distinction between value stream steps and operations seem simple, but it has very important consequences on improving productivity. Sometimes I find it easier to understand when we compare it to a theater play. The steps in the value stream, (making an appointment, checking the mouth and filling the cavity,) would represent what the spectators see on stage. On the other hand, the majority of the steps performed by our team members would represent the offstage training as well as all the preparations happening behind the scenes. All those operations are meant to serve the execution of the value stream, the play. In other words the steps of the value stream are given priority and the rest of the operations are accessory to the value stream.
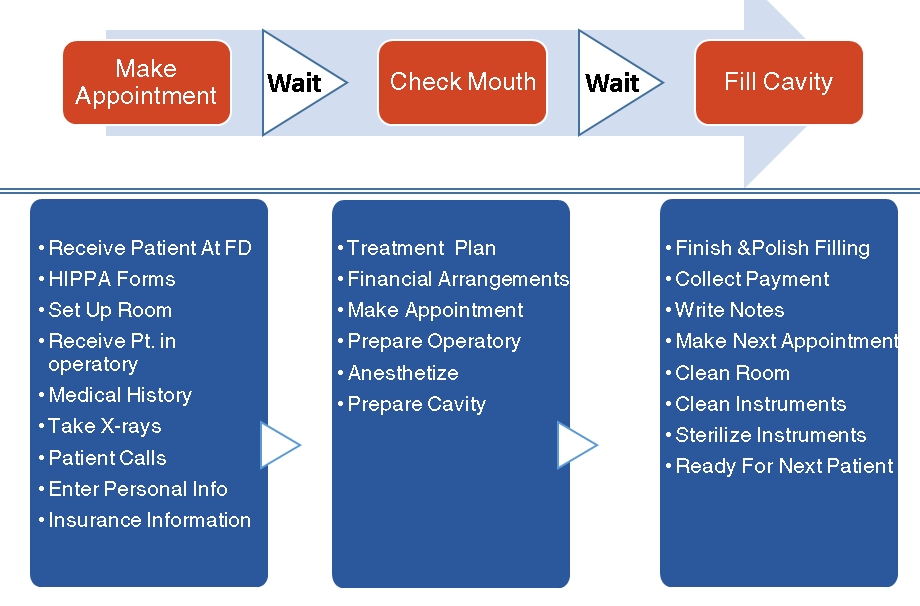 Figure 5: Value Stream and Operations
An opportunity to improve productivity
The operations, represented in the blue boxes, can present a considerable opportunity for improvement. The more we reduce the number of steps needed to make an appointment for example, the more efficient our operations will be. That is why operations should always be the subject of continuous improvement.
How we visualized operations
The value streams represent the horizontal axis in the structure of work, comparable to the X axis in a two-dimensional graph; it has been visualized by using a Kanban (signal). The operations are shown in the blue boxes, they could represent the vertical Y axis in the structure of work; we visualized them by assigning a separate card to each step or operation.
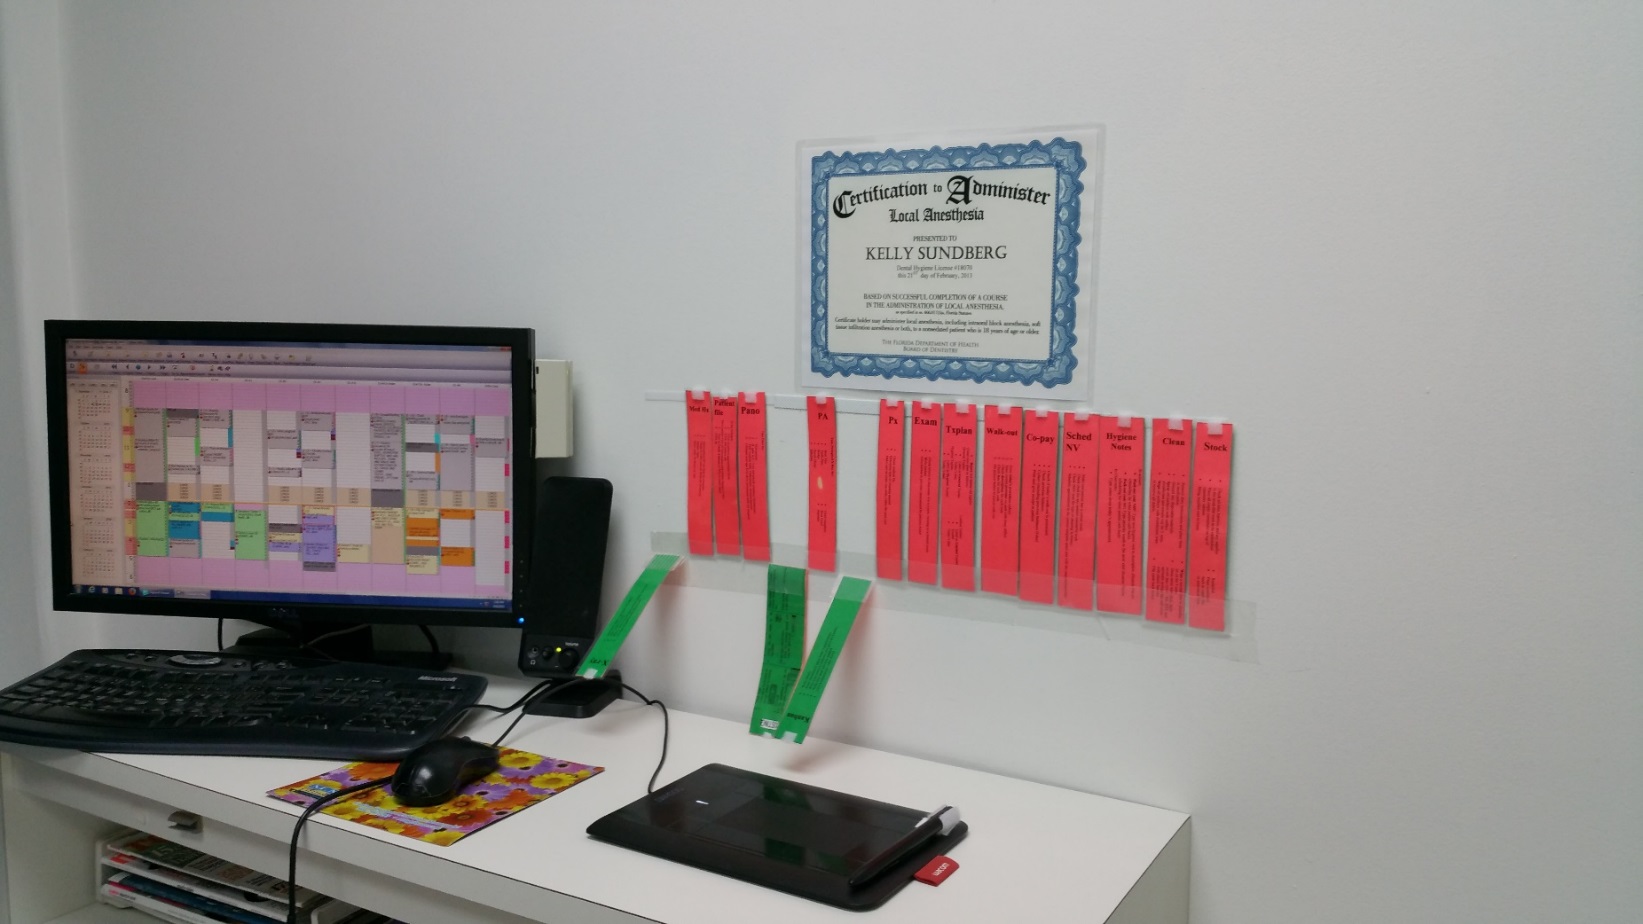 Figure 6: These cards allow (1) to observe work standards and (2) to make abnormalities visible
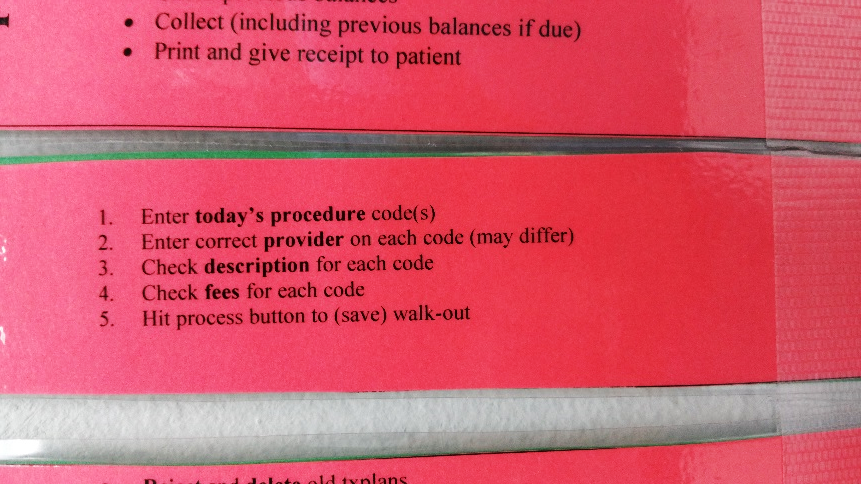 Figure 7: A closer look shows that the standards are on the cards, to make them accessible at all times.
Each card has a green side and a red side. When the card is turned on the red side it means that the step still needs to be performed. And, after it is performed, we turn the card to its green side. That is a very simple visual tool that allows team members to remember every step without any supervisor pressuring them. It also allows the flow manager, as she walks down the hallway, to observe which room needs help, and which assistant can help others.
Including the standards
As we have said previously, in order to prevent mistakes we need to make to the standards visible and accessible to employees, instead of hiding them in manuals. For that purpose, we have included on both sides of each card, the name of the step or operation, and the standards that we expect team members to follow. That step not only reduced mistakes, it also reduced the length of training needed for new members to learn each procedure. As a consequence it reduced the cost of operations.
Making it easy encourages people to use it
When we first introduced the card system, we asked assistants and hygienists to flip each card manually from red to green as the steps were executed. Then, for the next patient, they needed to reset by flipping each card separately back from green to red. That was time-consuming and wasteful.
I saw their exasperation every time team members used the cards. Needless to say that they avoided their use every time they could. So, we set as a goal to simplify the procedure and to make the resetting very simple. For that matter, we taped the bottom of the cards to a cabinet next to the computer, and we used Velcro to hold them up right when they were reset for use. To use a card, all a person had to do was to flick it down; to reset, all she had to do was push the cards up against the Velcro all at once. That simplification reduced the resistance to introducing this new concept into the practice.
Conclusion
We have benefited from understanding the two dimensions of the production structure. The first one, the X axis, was the value stream, or the onstage steps as perceived by the patient. We visualized that with a Kanban (Japanese for signal). The Y axis represented operations, the work performed behind the scenes by staff members. That part of the work can be the subject of continuous improvement in order to reduce the number and the duration of steps. The steps needed to be performed in order to meet the value stream just at the time they are needed. We have visualized those with a system of cards that have a green side and a red side. The red side indicates that the procedure has not been performed. The green side indicates that the step has been performed. Making the cards easy to reset encouraged people to introduce them into the system.
Using those two visual tools (Kanban and Cards) has allowed us to reduce mistakes by visualizing abnormalities as they happen so we can take preventive measures swiftly. At the same time team members have been able to execute their work without a supervisor breathing down their necks. Productivity has improved and moral has improved as well.
Ohno, T. (1988). Toyota Production System, beyond large-scale production. Portland, OR: Productivity Press.
Shingo, S. (1989). A Study of the Toyota Production System from Industrial Engineering Viewpoint. Portland, OR: Productivity Press.